# Load packages ----
library(tidyverse)
library(sf)

# Read CLC data and EEA grid ----
clc <- st_read("data/CLC2018/CLC2018.shp")
eea <- st_read("data/FRAME_EEA.gpkg")

# Create new column with Level-1 code ----
clc <- clc |>
  mutate(Level1 = str_sub(Code_18, 1, 1))

# Dissolve by Level-1 CLC class ----
# Slow ~11 minutes
clc_dissolved <- clc |>
  group_by(Level1) |>
  summarise()

# Intersect CLC and EEA grid ----
# Slow ~15 minutes
clc_in_grid <- st_intersection(eea, clc_dissolved)

clc_in_grid_area <- clc_in_grid |>
  mutate(area = st_area(clc_in_grid))

# Create centroids from intersection ----
clc_in_grid_centroids <- st_centroid(clc_in_grid_area)

# Join dominant CLC classes to original grid ----
clc_in_grid_final <- eea |>
  select(geom) |>
  st_join(clc_in_grid_centroids) |>
  group_by(CellCode) |>
  top_n(1, area)

# Visualise the result ----
ggplot(clc_in_grid_final) +
  geom_sf(aes(fill = Level1))
R vs. QGIS: R wins in match overtime
R versus
In our Geospatial Data Carpentry for Urbanism workshops, we often receive the question: why R and not QGIS? Answering this question is not straightforward (both are great), so I’ll try to do it by sharing a personal experience.
Recently, Daniele Cannatella and I gave a QGIS workshop to around 70 MSc Urbanism students at TU Delft. It did not go well as we had to deal with unforeseen technical issues for most of the workshop. We updated the problematic tutorials after the workshop to make them more accessible and to overcome such issues in the future.
While updating the QGIS tutorial, I also tried to reproduce the process in R: in a few lines of code and fewer steps.
R felt so much simpler while QGIS felt like this:
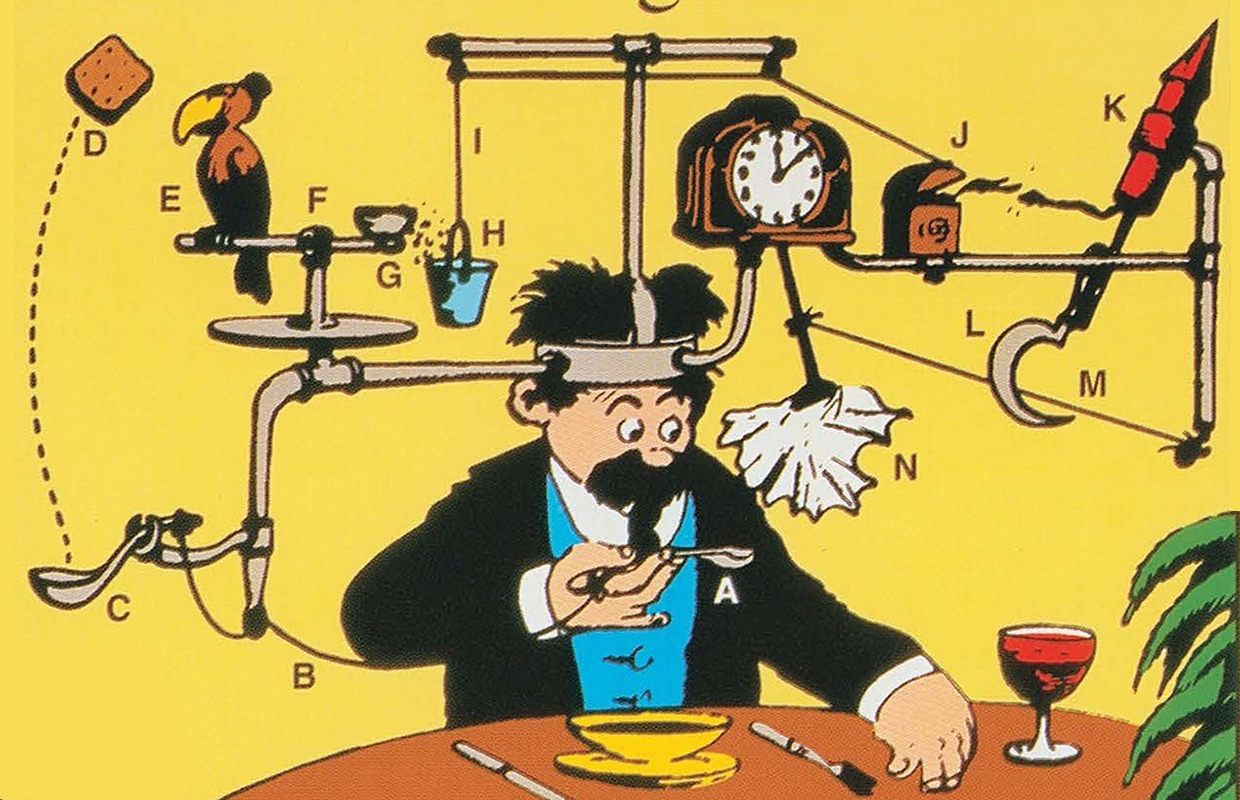
This is not to say that QGIS is worse, but that its point-and-click approach works very differently from R’s code-based approach. As I see it, R takes you to the essence of the problem you want to solve without the distractions of a Graphical User Interface. Yes, it takes more time to learn, but you can get your GIS work done with it while being able to automate, scale and ensure that your workflow is reproducible by others.